Click this link to upgrade to the New SMH for R 49/month https://centurionsolar.co.za/upgrade/
SMH fully supported by Centurion Solar https://centurionsolar.co.za/
Watch the Video for an idea of how the Software can help better monitor your system
Link to Video Tutorials for SMH https://www.youtube.com/results?search_query=centurion+solar
Check out www.CENTURIONSOLAR.co.za and register to be upgraded in the next 14 days.
🔥 ICC IS NOW OFFICIALY SMH! (and free to upgrade for ALL existing ICC users) 🔥
A year and a half in the making, we are proud to present you with the long awaited SMH, short for Solar Management Hub.
Without further a due, let’s jump straight into the benefits and features:
Probably one of the most important features of SMH is the absolute and total accountability and security architecture on which the entire product rests. Not only did we incorporate end-to-end multi-layer encryption in everything we do, but we also made sure that there will be no more finger-pointing from clients claiming they did nothing wrong but can’t explain why the settings were changed.
Literally EVERYTHING happening in the system is logged. Even when a non-user related event like Utility Failure occurs, it will still show that the System-user recorded the event.
Every Inverter change is recorded as well. From enabling the backlight to configuring the maximum charge rate per inverter and more. Everything is catalogued and can easily be recalled, should the need for it arise.
There is also an ever-present status bar right at the bottom of the SMH client, showing the Operating Mode, the logged in User, as well as the Command Status from the inverter.
Another big feature is full home automation capability. We can speak to all MQTT based systems like OpenHAB, Home Assistant, etc, which will allow you to configure switching based on load, eskom availability and more.
A user-management module is also included, allowing installers to create lesser-privileged accounts for their clients, further ensuring that no change happens without showing what changed and who changed it.
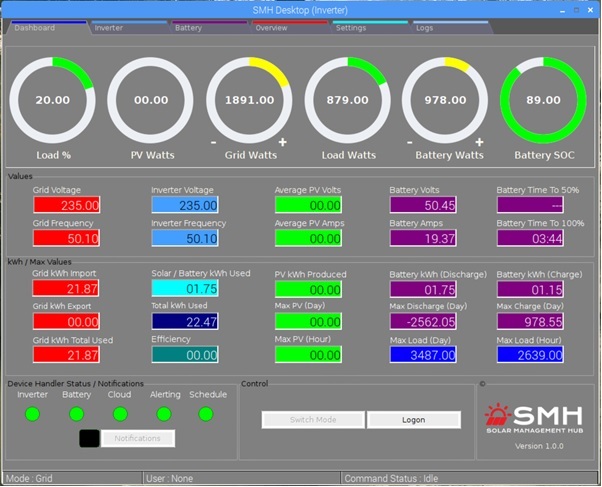
There is a completely new desktop client that runs on the Pi, where everything has a tooltip. If you don’t know what something means, simply hover your mouse over it and a popup with an explanation will appear to help you along the way. Among the data you are used to, we have also included a field for “Battery Time to x%” and “Battery Time to 100%”. If you use a compatible battery, we will calculate an approximate runtime based on the load to get to the configured % SOC (when running in battery mode). This is brilliant for load shedding, as it will indicate when to start using electricity more sparingly in order to extend the runtime.
The entire product can also be white-labelled for orders of 10 or more new Pi’s, allowing the installer to sell “his own monitoring solution” as part of his installations.
On the other side of the discharging calculations, the Battery time to 100% will give you an indication of how long the battery bank will take to fully charge according to the current charge rate, which again is very useful to determine if the batteries will be full by the time the next “eskom se push” comes up to spoil your day. All of the calculations mentioned above are done using Peukerts law, and even take things like the battery inefficiency (adjustable per battery), etc into account in order to be as accurate as possible.
SMH also boasts a modular design technology, using something we call handlers. Effectively they are a set of instructions, calculations and commonly used tasks, grouped together in order to share those across different inverters, batteries, etc. This design also makes the system a lot more stable and easier to troubleshoot in the event that something goes wrong, as each handler can be investigated and interrogated individually.
Using handlers also allow us to look at what information an inverter gives, and then capture the math to work out all the system totals, etc in something called the Inverter handler. This means that the work to add an inverter was only done once, so all we do from there is to get the protocol document for any new inverter and add the unique commands to get the information required by the handler to operate. The handler takes care of the rest. This allows for a rapid development cycle and also ensure that we can stay current with more inverters, more often.
The same thing was done with the battery handler, so to add batteries and inverters will technically take us longer to test in the field than it takes us to add it into SMH ;). If you are using a compatible BMS, we will also constantly monitor the communication with the hardware, and perform a full recovery procedure, should anything go wrong. SMH was built from the ground up with a completely rewritten USB subsystem, not using the original (but now completely daft and deprecated) intelligent customised coding (ICC) “hidraw” usb version that so many others have used in the past. It turns out it wasn’t so intelligent to use that after all… lol!
We also monitor the individual serial numbers of each battery, together with its fault code, so if anything does go wrong, it will report on the exact serial number of the battery acting up, allowing the installer to collect the correct equipment for repair.
The cycles per battery make it easy to determine which battery is more likely to reach end of life before the rest, allowing you to plan your next battery expense in advance. Combined with the ability to run different sized batteries together in one bank, it also made sense to determine the AH rating of each battery, further allowing the installer to see how slow / fast the different sized batteries are charging or discharging.
As far as the cloud handler is concerned, we had to make extra sure that the data coming from the pi is stored in a reliable way, seeing as people rely on that to make very important decisions about the operation of their systems.
Warranty claims are often approved or denied based on the values recorded by the system. The cloud handler also constantly monitors the connection from the Pi to the cloud portal, so in the event that the Pi loses internet connectivity, it will cache the data coming from the inverter in the database until it can detect a stable connection to the server again, and then upload it to centurionsolar.co.za/smh retrospectively.
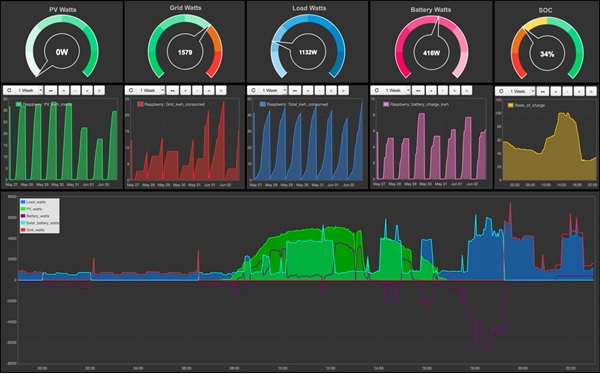
This means that as long as the Pi has power, it will record what’s happening, and that data cannot be lost. To that end, we had to rewrite the back-end in order to give every SMH user new dashboards, showing the real-time value of the most important metrics, as well as a weekly summary of each of those, together with a beautifully created live dashboard that combines all the energy flows in an easy to understand fashion.
We also took your eyes into account, and designed all the dashboards to be in dark mode with soft pastel colours, which not only makes them easier to see and read, but also reduces energy consumption. Check out a live version here: Analytics dashboard
There is also a brand new cellphone desktop, designed to simply be saved as a shortcut on your phone. Simply opening it up will show you how energy is being consumed in your system at that moment in a very easy to understand, elegant and clean manner. A live version of this can be seen here: Cellphone Dashboard
There is also a lightweight version of the SMH Desktop running in the cloud portal, to allow the installer in the field to gain some more technical information about the system, should it be required.
As if all the above cloud portal detail is not enough to keep you entertained, we have also included a web app, allowing something with a much stronger processor than the pi (like your desktop or cellphone) to render beautiful graphics coming from the pi in real-time. At the moment this is accessed on the same local network as the pi, but it can also optionally be accessed from anywhere in the world without any fancy port forwarding or router configuration required. This means you can have a constant display running at your office or home, showcasing your system in an ever-updating, beautiful manner. The web app is also responsive, meaning that it will scale dynamically to fit on a cellphone, all the way up to an 82″ television automatically.
.
All the values one would expect to see are gathered from the system and displayed in the same vibrant, easy to read and understand fashion.
Individual inverter performance (up to 9 supported inverters) are shown, together with the totals produced by all of them.
There is a dedicated page for the batteries, which again shows the totals at the top, and then the individual battery details at the bottom.
Lastly, there is also a full analytics engine, showing you what the system cost to put in, what your daily savings are (based on your usage), together with how long it will take to recoup the money spent on the system. You can also look at the data that make up these figures for every day, week, month or year.
Looking at the settings page, you can see that we have a multitude of options available.
There is a fully integrated Telegram communication system, allowing you to get notified of any warning or fault in your system in near sub-second response time. Never again will you have loadshedding without your system informing you about it. Once the utility power is restored, the system will automatically inform you that the utility failure has been resolved.
You can also configure which alerts make sense to you or not, tailoring them to your unique requirements. If your system has sub-alerts (sometimes referred to as Parallel alerts like error 80 for CANbus or 69 for Battery comms), those can be configured as well. Alerts can be sent to an email address and/or Telegram or just to the notify window on the dashboard, which will flash when you log in to let you know that something is wrong.
When alerts are set to be shown as notifications, the user will be presented with a flashing icon on the SMH desktop, from where they can click to see the errors and then clear the log.
Every feature that watchpower support have been meticulously re-created with the same look and feel you are used to. For multiple inverters you simply have to select which one you want to alter, and the system will request its data. Once received, you can adjust the settings in question, and move on to the next inverter.
Finally, we also cater for enterprise customers, whereby the pi’s they buy from us can be configured to post all their data to an enterprise portal, allowing the client to drill down all the way from a geographical map with hundreds of systems, to the specific system in question. Customisable alerting with enterprise alert acknowledgement and call resolution ensure that all systems can be monitored at the blink of an eye, even in a geographically dispersed environment.
Once selected, a specific system will so an overview of its own data, from where the user can drill down even more to see the real-time performance data of the actual inverter:
Apart from displaying real-time values, the system also records everything, allowing the user to select anything from the last minute to the last year or more.
To further assist users that don’t know how to operate things like VNC or Anydesk properly, we decided to make a Windows, Linux and MacOS client that connects to the Pi over the network and run as a native app. This means that the Pi is configured once, and after that the client can simply click the shortcut on his desktop to open the client for his respective operating system and start seeing the values, etc. Multiple instances of the client can also connect at the same time, making it perfect for a permanent display in the living room, with another for use in the study for instance.
Below is a screenshot of the MacOS client:
And also the Ubuntu client:
In closing: All the screenshots, cloud dashboards, enterprise dashboards, home automation, web app, local client, etc all run from a single pi. As you probably saw, we don’t do any graphics directly on the Pi, but rather offload that to the cloud, web apps, etc. This not only allow us to do SO MUCH MORE with the data, but also ensures that the pi runs cool, as the average CPU consumption to do all of the above is only about 8 to 15% on a Raspberry Pi3b. On a Pi4 this comes down even more.
There will be a R49.99 subscription per month to help pay for all the services offered, our dedicated support people, further development, cloud servers, etc, but once you take everything above into account, I am sure you will agree that it’s really not a lot to ask for all of this, and as mentioned, if you are an existing ICC user (regardless of where you bought it originally), you can register to be upgraded to SMH for free, and just pay the subscription from there.